
Track 1: Advances in Discovery, Formulation, and Delivery of New Modalities
Category: Poster Abstract
.jpg "Bishal Misra photo")
Bishal Misra
Graduate Student
West Virginia University
Morgantown, West Virginia, United States
Sharan Bobbala, Ph.D. (he/him/his)
West Virginia University
Morgantown, West Virginia, United States
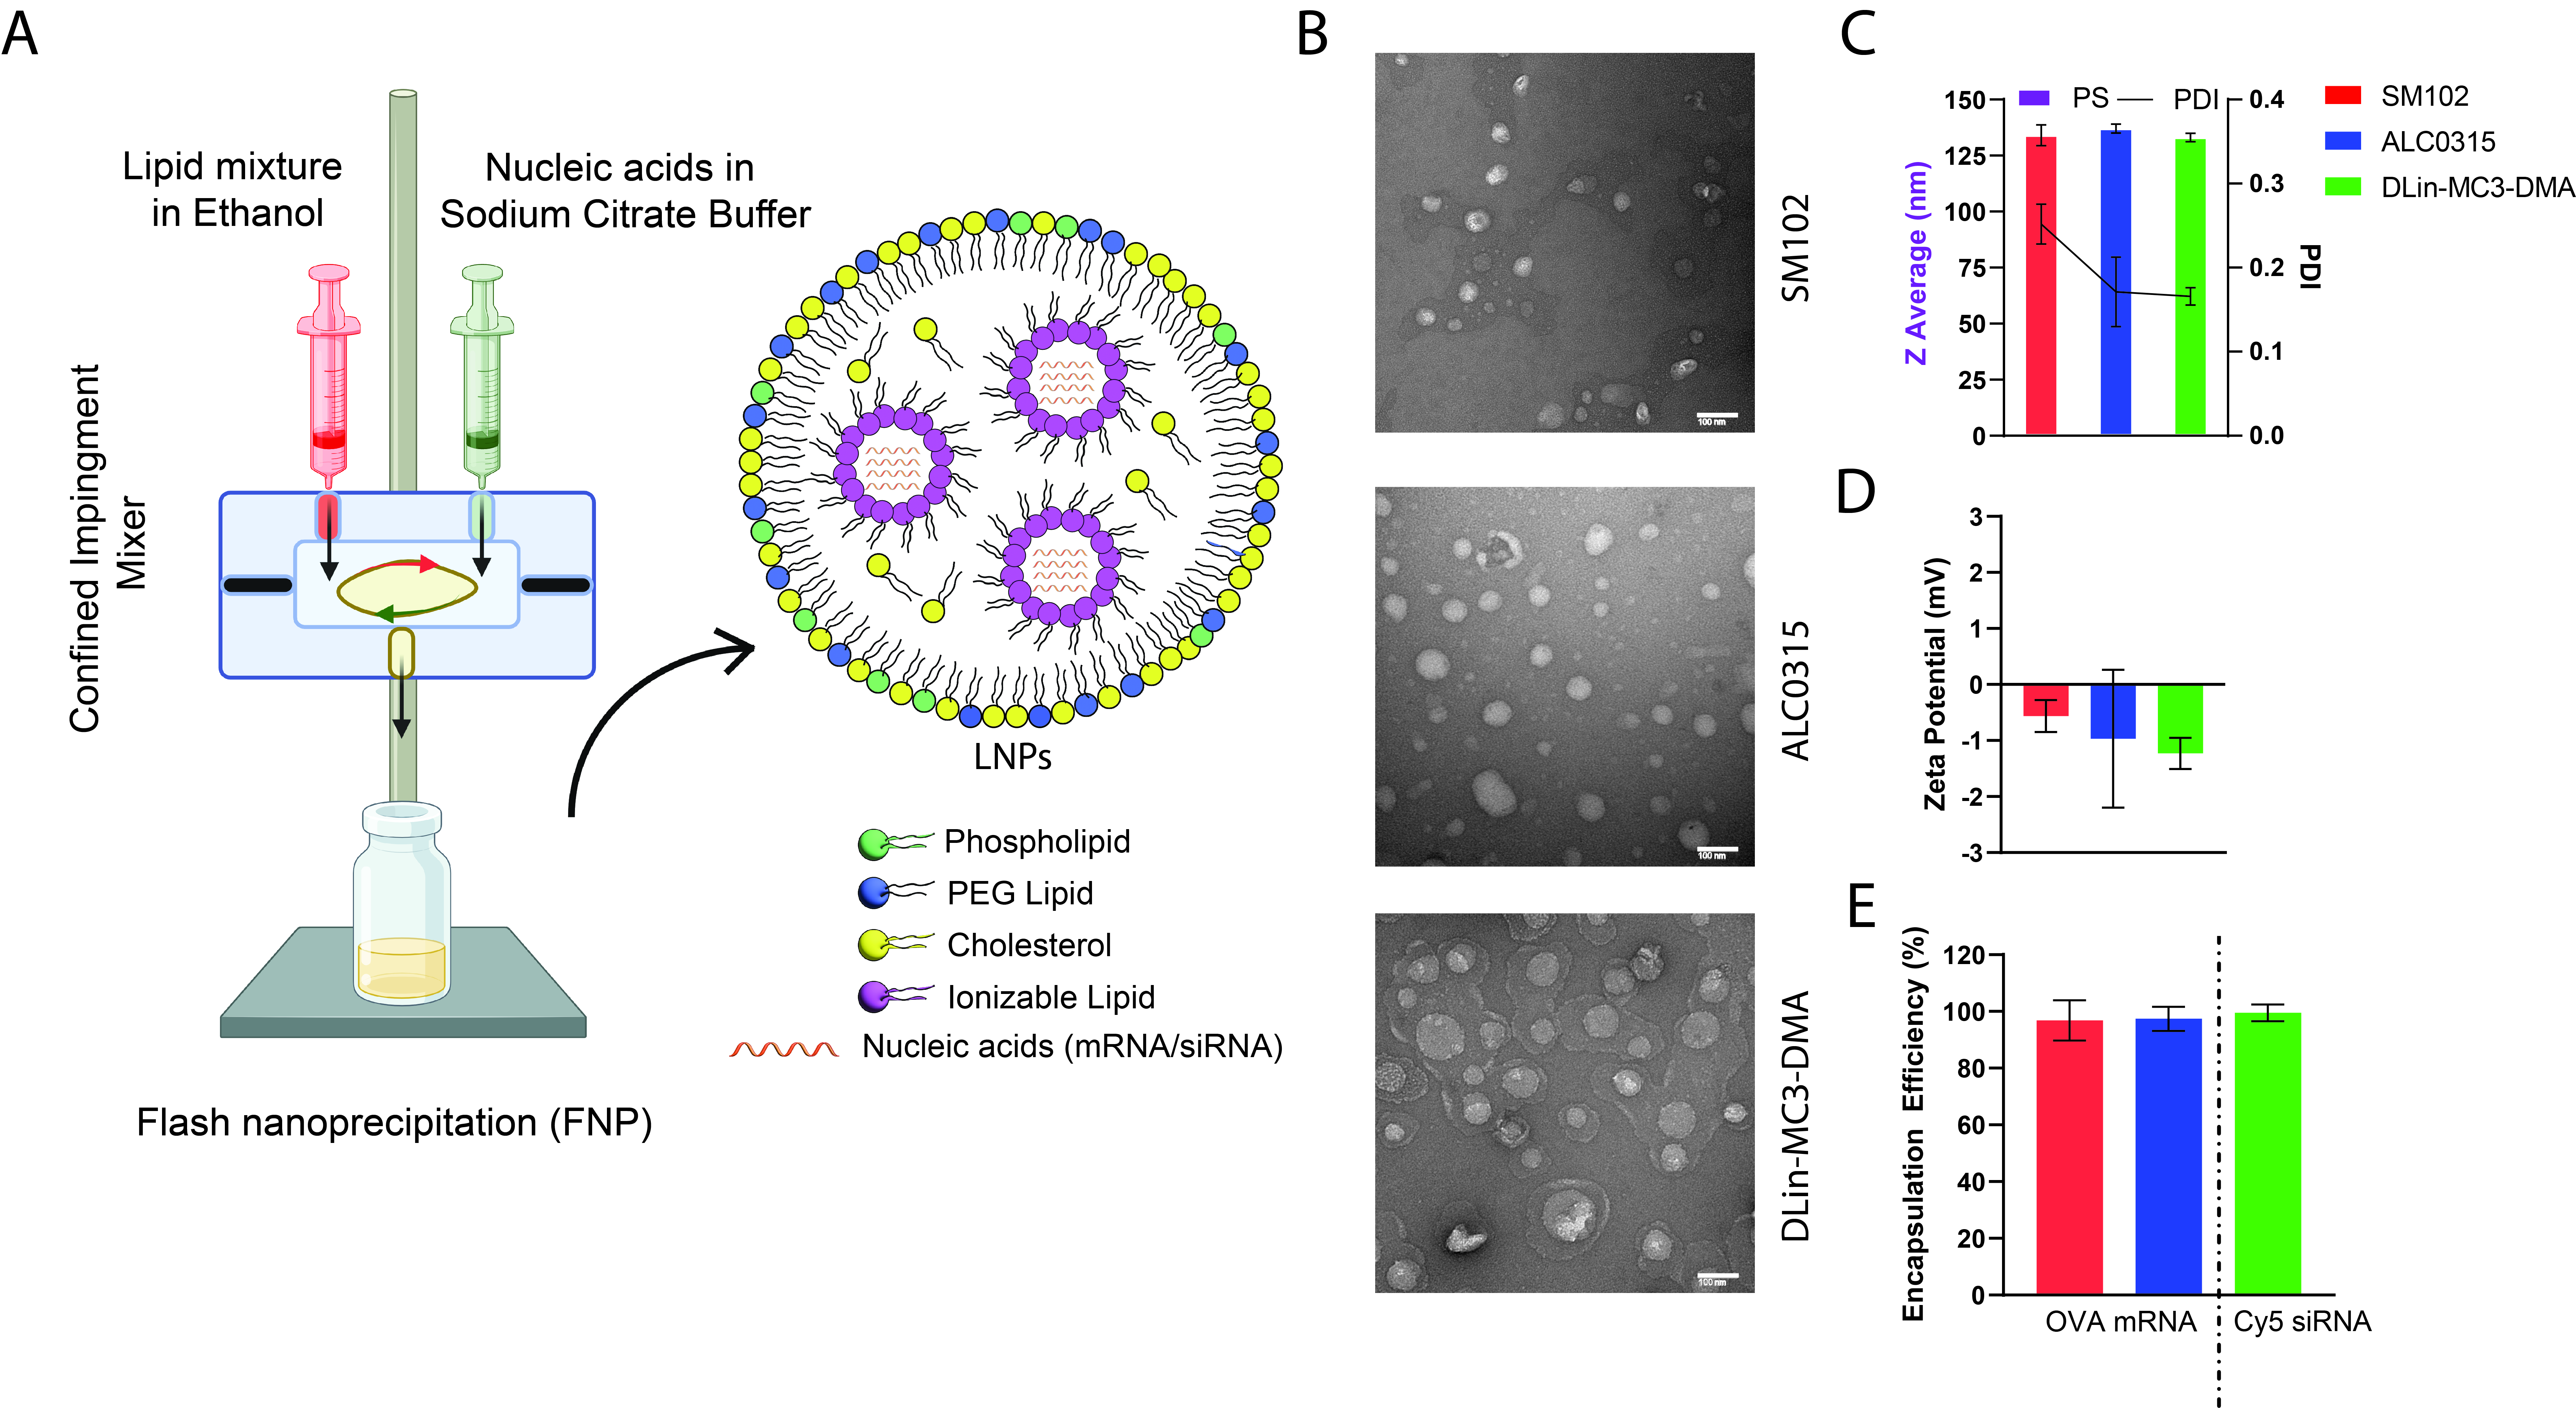 Fig. 1. Fabrication and physicochemical characterization of lipid nanoparticles. A) Schematic showing the preparation of nucleic acid (RNA)-loaded Lipid Nanoparticle (LNP). LNPs were prepared by the Flash Nanoprecipitation (FNP) technique using a Confined Impingement Jet (CIJ) mixer. The LNP is composed of a helper phospholipid (Green), PEG lipid (Blue), and structural lipid Cholesterol (Yellow). Nucleic acids are entrapped with the help of the ionizable lipid (Violet). B) Negative stained transmission electron microscope (TEM) images for the SM102, ALC0315, and DLin-MC3-DMA ionizable LNPs. The TEM image scale is 100 nm. C) Particle size of LNPs was measured using dynamic light scattering, and the hydrodynamic diameter is reported as a Z average and reported in nm. D) Zeta potential was measured by electrophoretic light scattering and reported in millivolt (mV). E) Encapsulation efficiency of LNP-loaded mRNA or siRNA was measured using the QuantiFluor® RNA System. Data represented in C, D, and E are mean ± SD (n=3). The image was created with BioRender.com.
 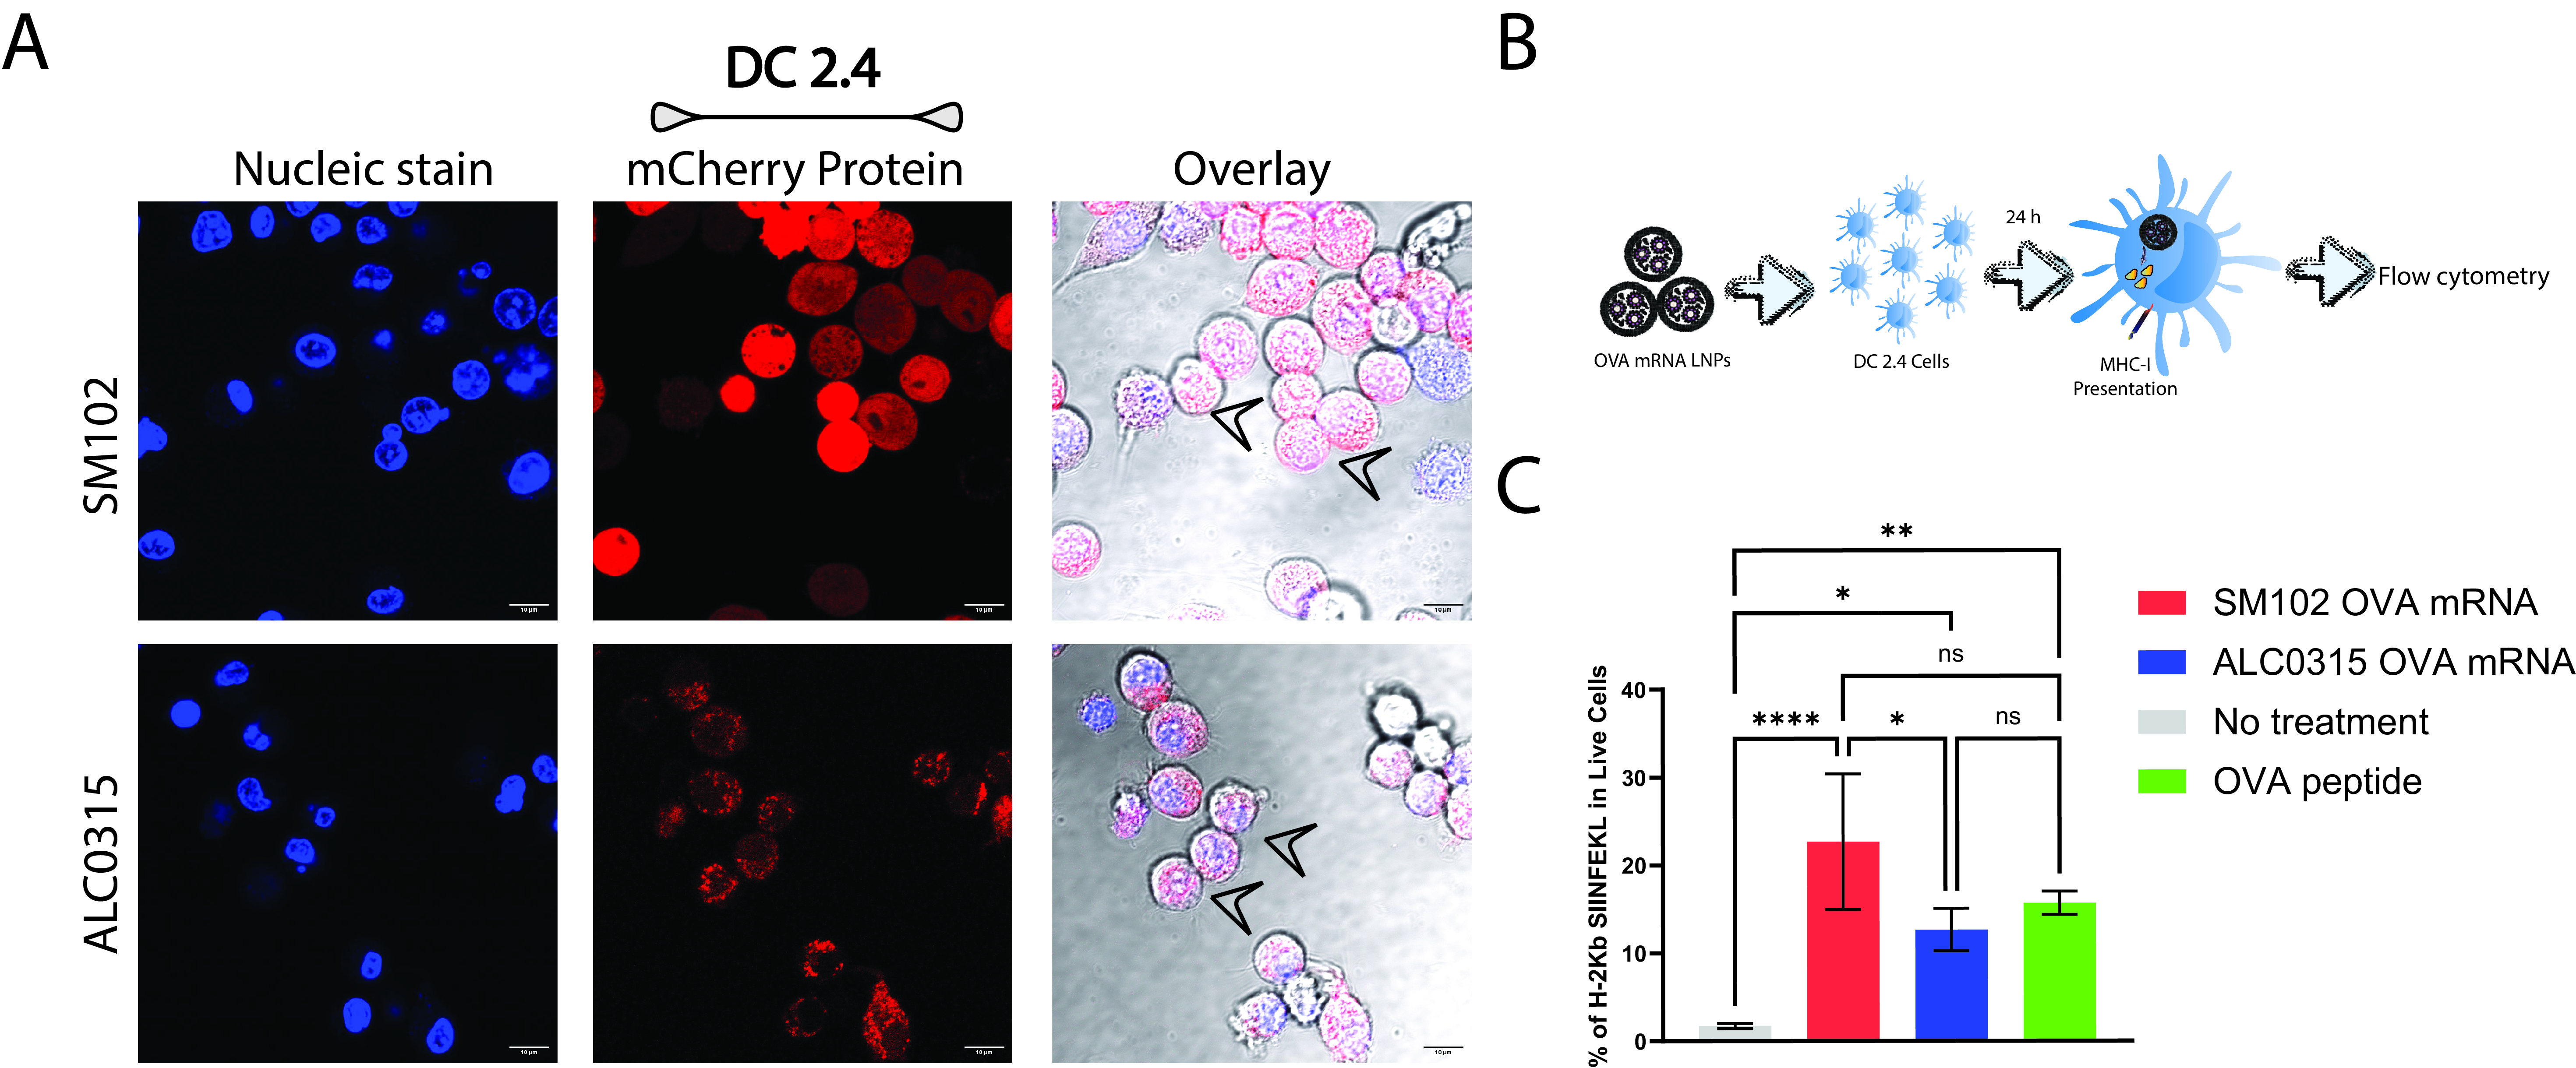 Fig. 2. Intracellular delivery of mRNA using LNPs in DC 2.4 dendritic cells. SM102 and ALC0315 LNPs were encapsulated with mCherry mRNA and incubated for 24 h with A) DC 2.4 cells. mCherry mRNA encoded into mCherry protein (red color) indicates successful cytoplasmic delivery of mRNA by LNPs. Live-cell images were taken using a confocal microscope with a 60X objective and red punctae inside the cells indicated by black arrows. The scale bar is 10 μm. B) Schematic showing functional SIINFEKL assay. DC 2.4 cells were treated with OVA-mRNA loaded SM102 and ALC0315 lipid nanoparticles or OVA peptide as control for 24 h, the dose of the OVA-mRNA was 1 µg/mL in each well. C) The expression level of the H-2kb antibody-bound OVA257-264 (SIINFEKL) was reported. Data represented as mean ± SD (n=3). Significant differences between each timepoint were determined by one-way ANOVA with Tukey’s multiple comparison test, ****p < 0.0001, **p = 0.002, *p = 0.0121 for ALC0315 LNPs and no treatment, and *p = 0.0214 for SM102 and ALC0315 LNP formulations.
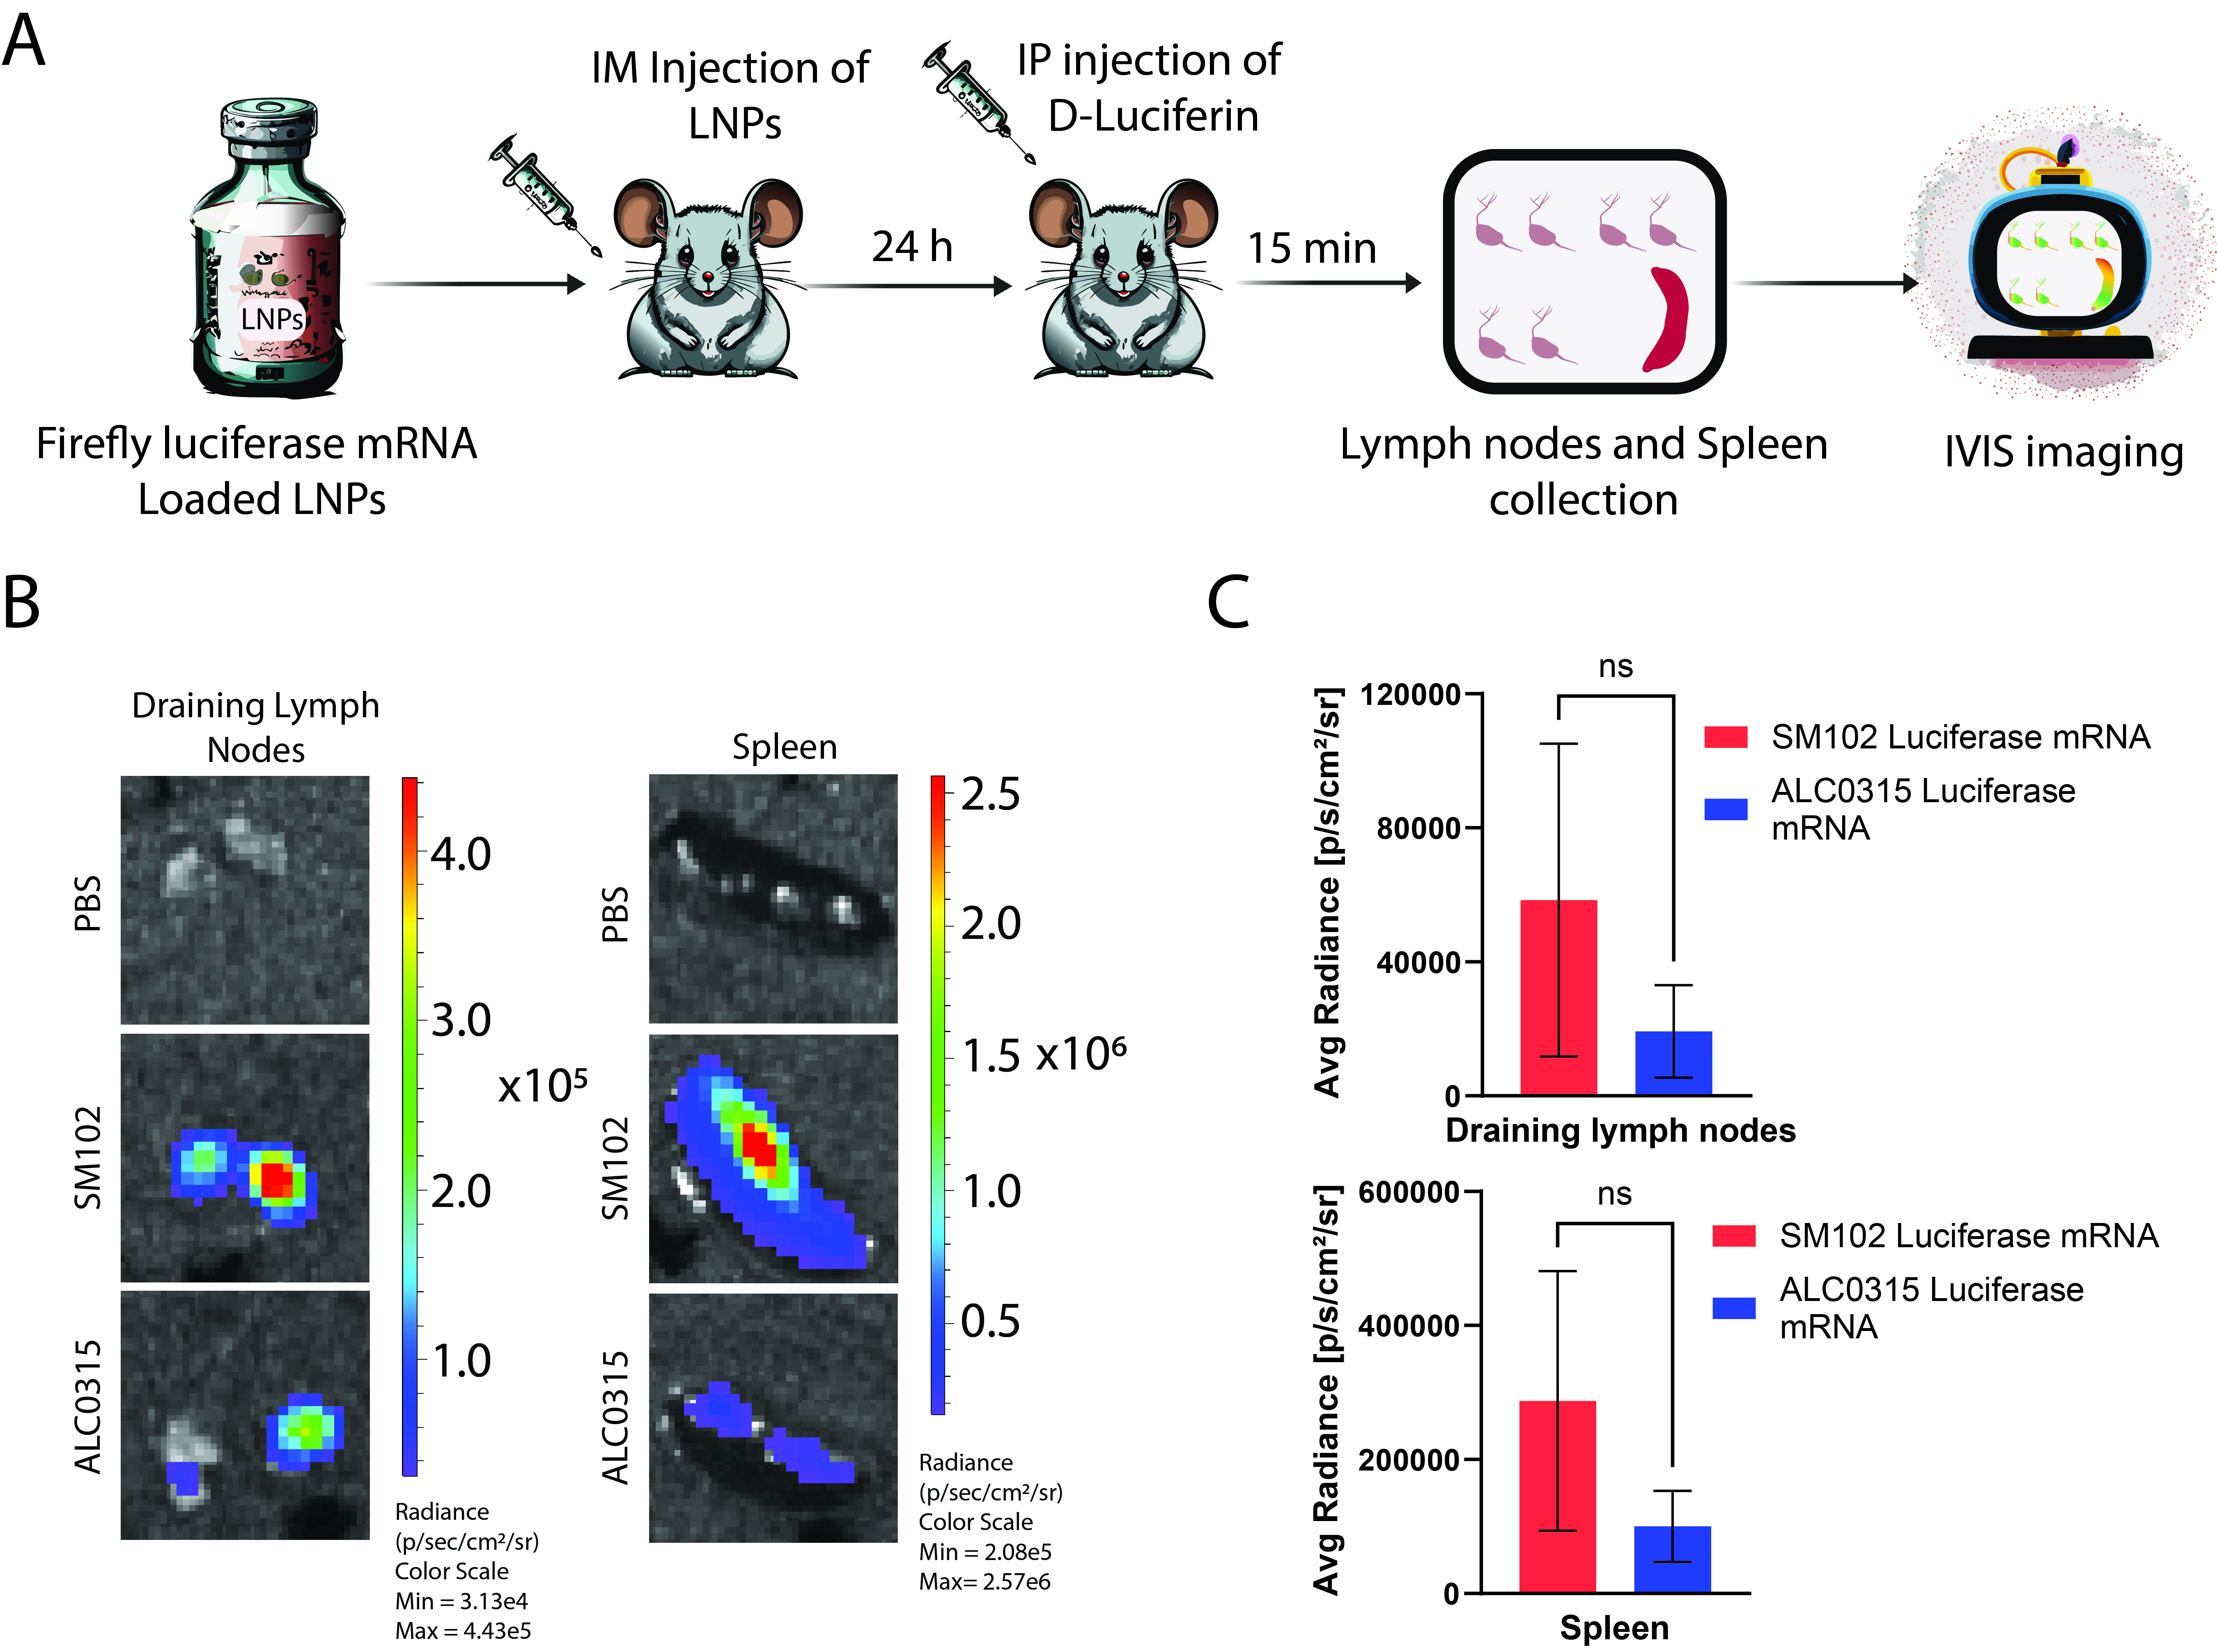 Fig. 3. In vivo delivery of mRNA using LNPs in C57BL/6 mice. A) Schematic representation of firefly luciferase mRNA loaded LNPs, route of administration, and IVIS imaging of lymphoid organs. B) IVIS bioluminescent images of draining inguinal lymph nodes and the spleens of SM102 LNPs or ALC0315 LNPs or PBS only administered mice. C) Bioluminescence is represented as average radiance in draining lymph nodes and spleens of mice administered with SM102 and ALC0315 LNPs. Data represented as mean ± SD (n=3).