
Track 1: Advances in Discovery, Formulation, and Delivery of New Modalities
Category: Poster Abstract
Nidhi Thite
University of Colorado Boulder
Boulder, Colorado, United States
Nidhi Thite
University of Colorado Boulder
Boulder, Colorado, United States
Emma Tuberty-Vaughan
AstraZeneca
Gaithersburg, Maryland, United States
Paige Wilcox
AstraZeneca
Gaithersburg, Maryland, United States
Nicole Wallace, Ph.D.
AstraZeneca
Gaithersburg, Maryland, United States
Chris P. Calderon
Ursa Analytics
Boulder, Colorado, United States
Theodore W. Randolph
University of Colorado Boulder
Boulder, Colorado, United States
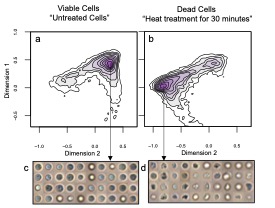 Figure 1: Contour plots showing “fingerprints” or the estimated probability density functions of CNN embeddings for FIM images of a) unstressed Jurkat cells (i.e., control/viable cells) and b) Jurkat cells imaged after incubation in a water bath controlled at 47ºC for 30 minutes (i.e., dead cells). Representative FIM images sampled from c) viable and d) dead cell populations corresponding to the black arrow are shown. The two coordinates of the fingerprint representation are data-driven dimensions returned by the trained CNN-based algorithm and do not have a readily discernable physical interpretation.
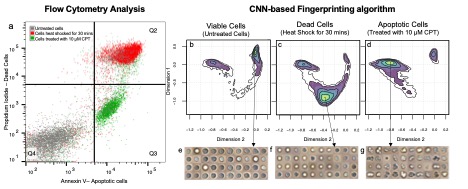 Figure 2: a) Overlay of flow cytometry density scatter plots of Annexin V – Alexa 488 versus PI for untreated cells denoted as viable cells (grey), cells heat-shocked for 30 minutes denoted as dead cells (red), and cells treated with 10μM CPT for 5 hours at 37ºC and 5% CO2 denoted as apoptotic cells (green). Contour plots showing “fingerprints” for the CNN-based fingerprinting trained on FIM images of b) untreated Jurkat cells denoted as viable cells, c) cells heat-shocked for 30 minutes denoted as dead cells, and d) cells treated with 10μM CPT for 5 hours at 37ºC and 5% CO2 denoted as apoptotic cells. The 40 closest (in terms of Euclidean distance) FIM images to the region indicated by the black arrow corresponding to e) viable, f) dead and g) apoptotic cell populations.
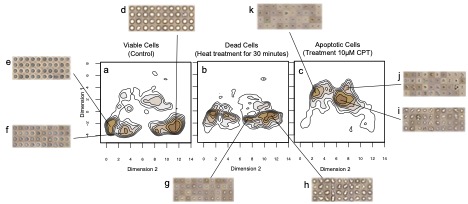 Figure 3: Contour plots showing the feature distribution obtained using UMAP for the VAE model trained on FIM images of a) untreated cells denoted as viable cells, b) cells incubated in a heated water bath for 30 minutes denoted as dead cells, and cells treated with 10μM Camptothecin for 5 hours at 37ºC and 5% CO2 denoted as apoptotic cells.