
Track 1: Advances in Discovery, Formulation, and Delivery of New Modalities
Category: Poster Abstract
Kalyanasundaram Subramanian
Differentia Bio
South San Francisco, California, United States
Milad Ghomlaghi
AliveX Biotech
Grand Cayman, Cayman Islands
Wanbing Zhao
AliveX Biotech
Grand Cayman, Cayman Islands
Hui Gao, Dr.
Peking University International Hospital
Beijing, Beijing, China (People's Republic)
Cuiping Pan
Greater Bay Area Institute of Precision Medicine
Guangzhou, Guangdong, China (People's Republic)
Aidin Biibosunov
Differentia Bio
South San Francisco, California, United States
Yan Ge
AliveX Biotech
Grand Cayman, Cayman Islands
Ruimin Sun
AliveX Biotech
Grand Cayman, Cayman Islands
Di Sun
AliveX Biotech
Grand Cayman, Cayman Islands
Xiaoqiang Hou
AliveX Biotech
Grand Cayman, Cayman Islands
Wei Ye
AliveX Biotech
Grand Cayman, Cayman Islands
Shirley Wen
AliveX Biotech
South San Francisco, California, United States
Atefeh Kazeroonian, Ph.D. (she/her/hers)
Differentia Bio
South San Francisco, California, United States
.jpg) Figure 1: Transcriptomic analysis of patient and control single-cell RNA sequencing data reveals the percentage of various immune cells in each group. Each column represents a subject in the corresponding group
Figure 1: Transcriptomic analysis of patient and control single-cell RNA sequencing data reveals the percentage of various immune cells in each group. Each column represents a subject in the corresponding group.jpg) Figure 2: The information flow due to various signalling networks in patient and control groups. The incoming and outgoing signalling mediated by various cytokines were analysed based on scRNAseq data, and the corresponding information flow strength was compared between patients (blue) and healthy controls (red). The quantification of information flow and cell-cell communication was done in the CellChat package.
Figure 2: The information flow due to various signalling networks in patient and control groups. The incoming and outgoing signalling mediated by various cytokines were analysed based on scRNAseq data, and the corresponding information flow strength was compared between patients (blue) and healthy controls (red). The quantification of information flow and cell-cell communication was done in the CellChat package.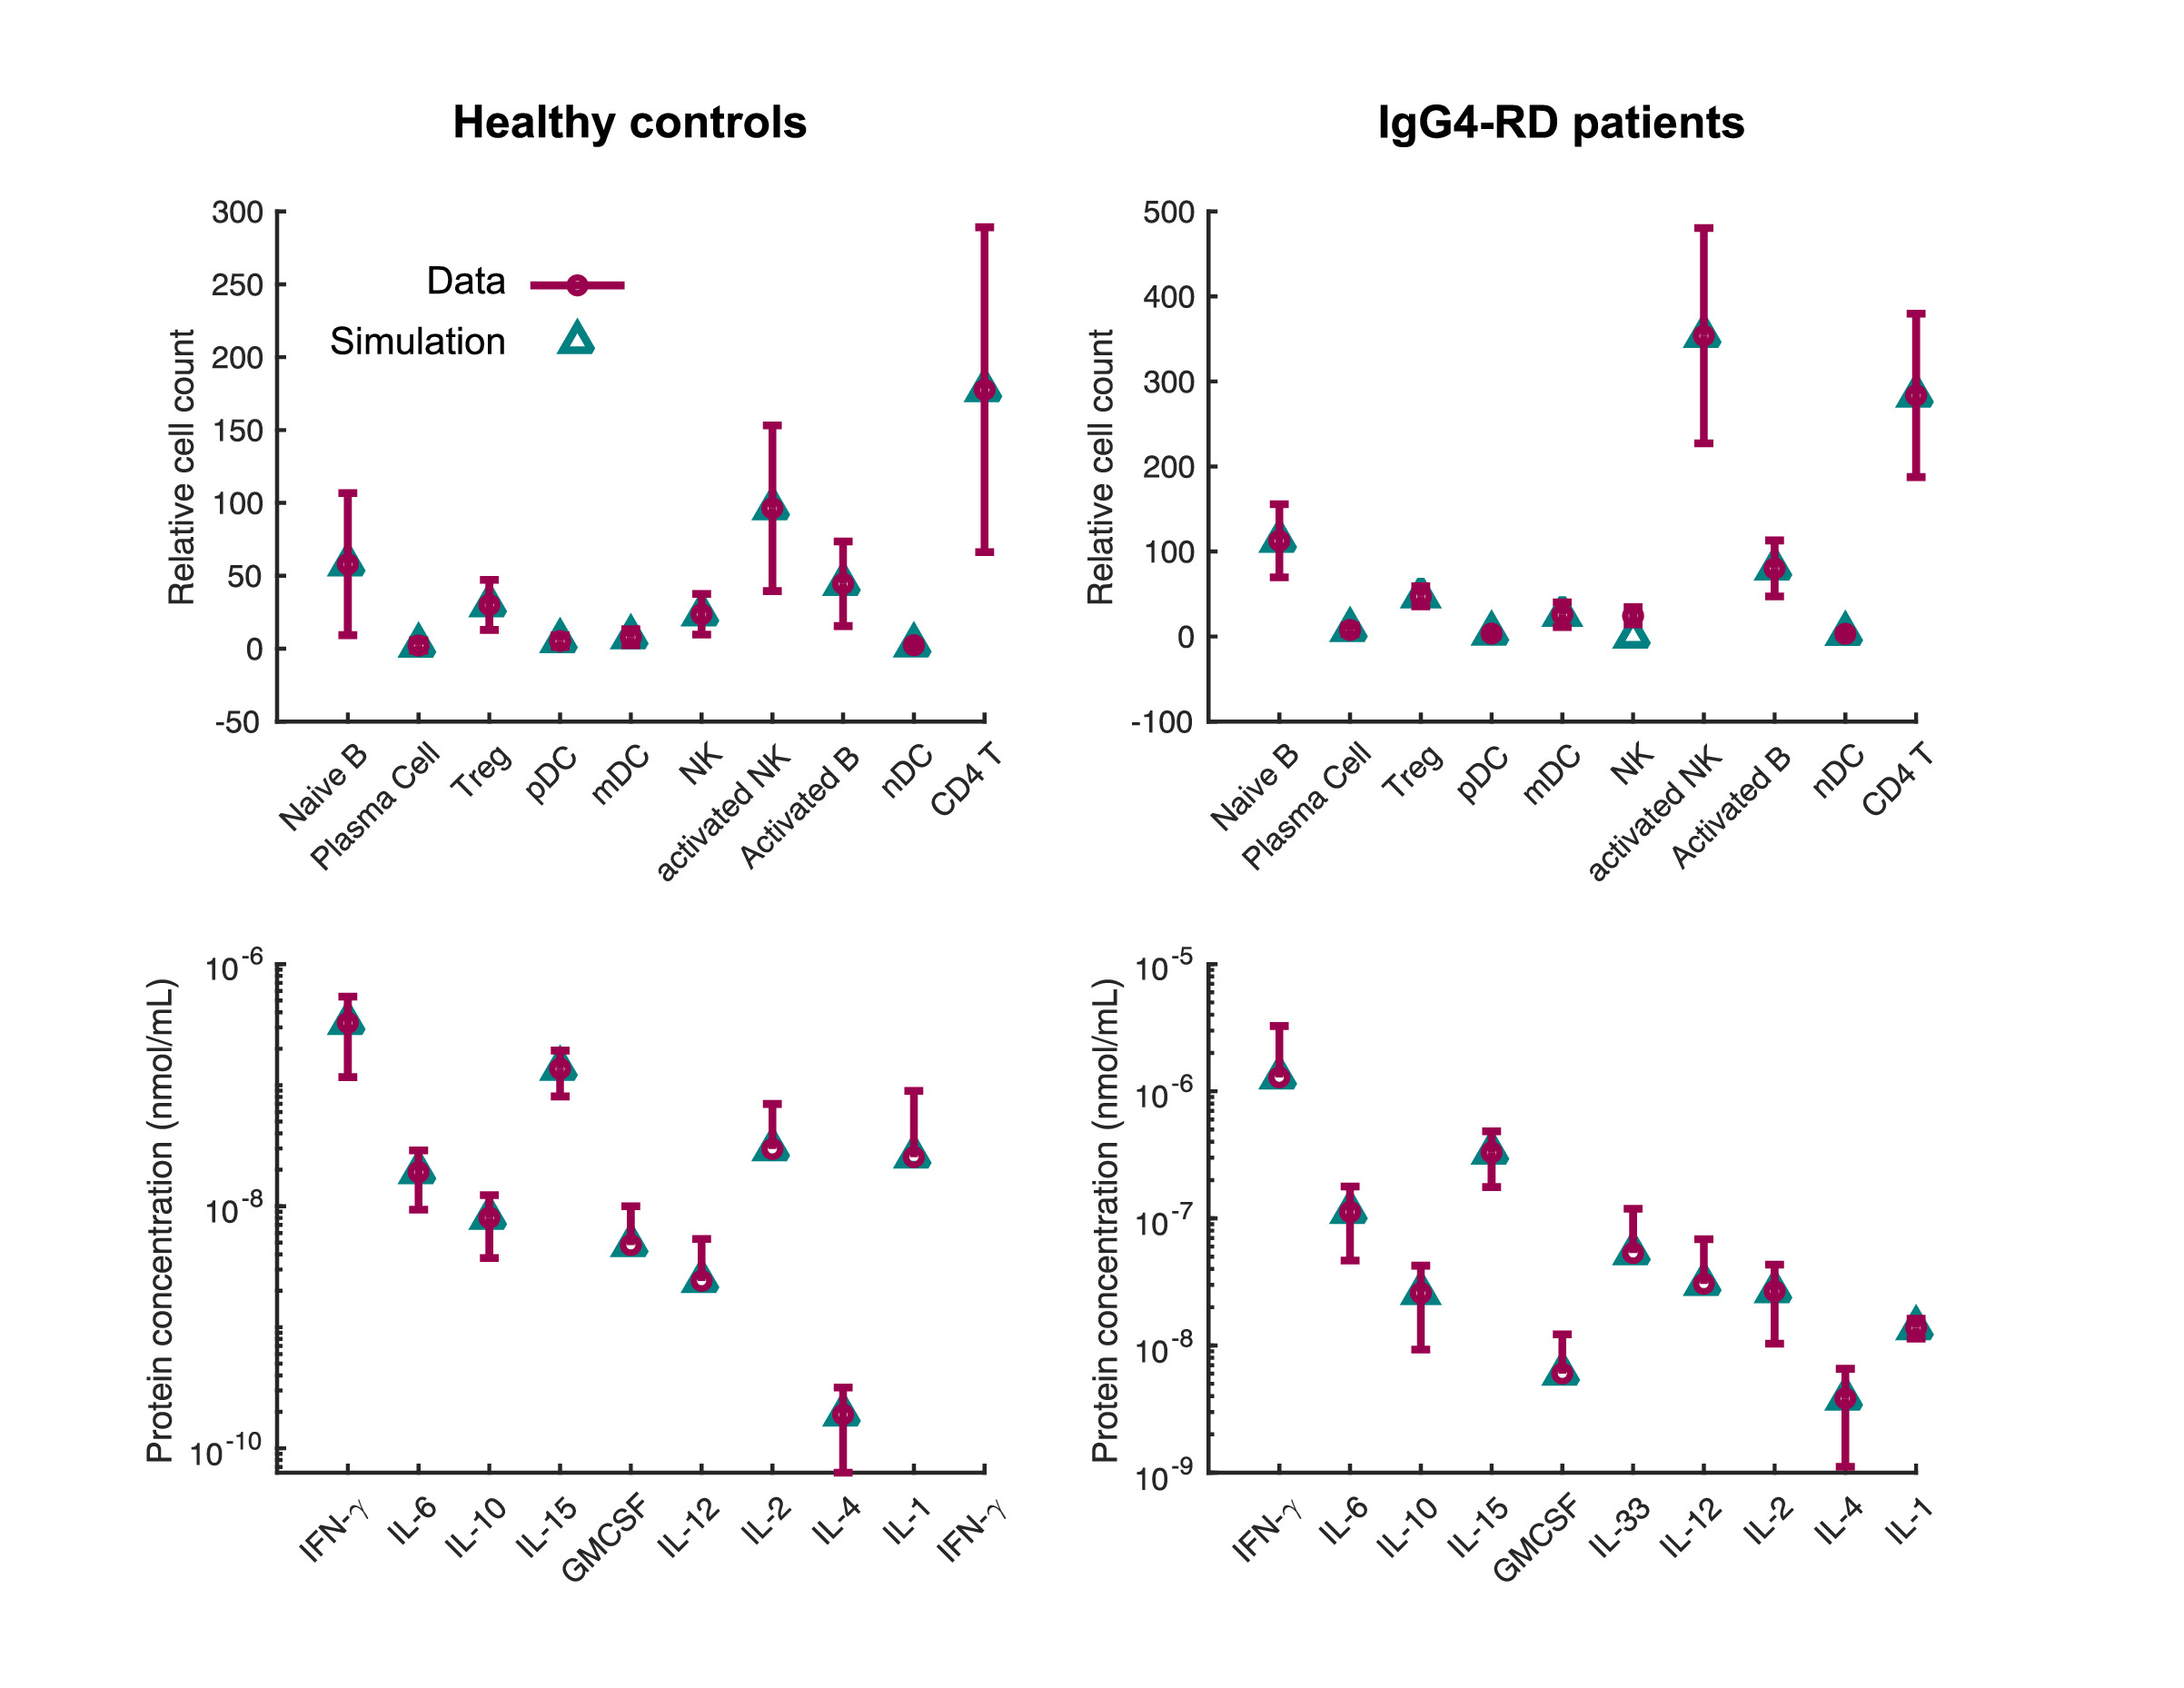 Figure 3: The calibrated IgG4-RD disease model reproduces the steady state data of patient and control groups. The comparison of model simulations against experimental data is shown for relative cell counts (top row) and protein concentrations (bottom row). The parameters of the disease model were (partly) estimated to fit the data.