(T1030-02-07) Analytical Method Validation Strategy for Determination of Charge Heterogeneity of Antibody Therapeutics Using Reference Material Comparison as an Alternative to Spiking Studies
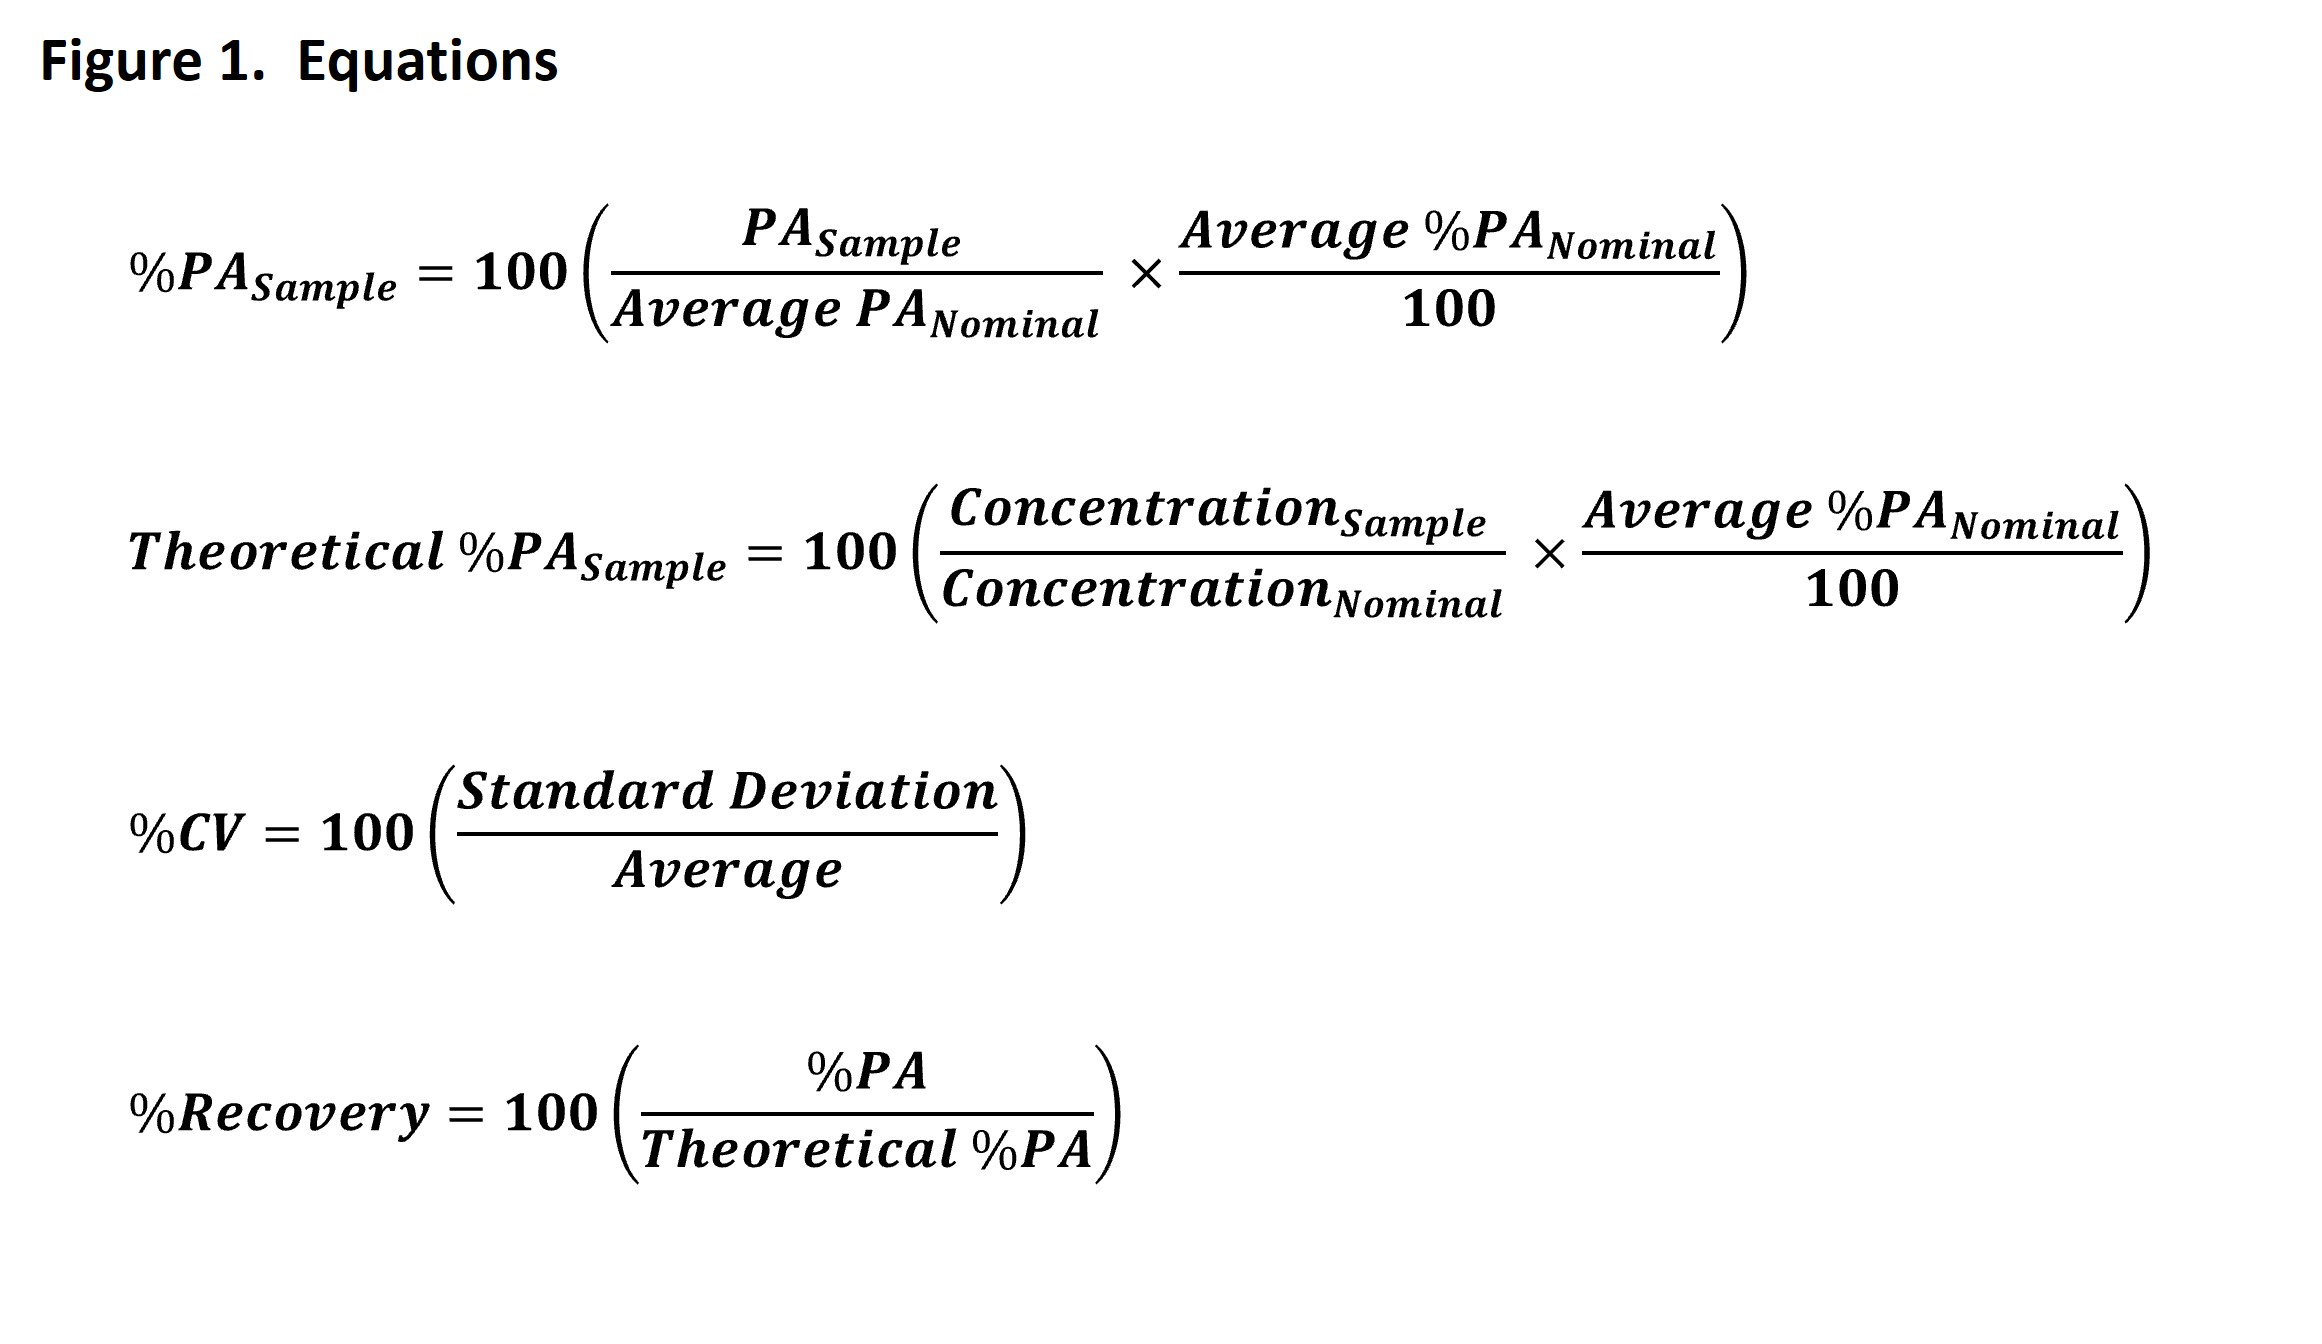
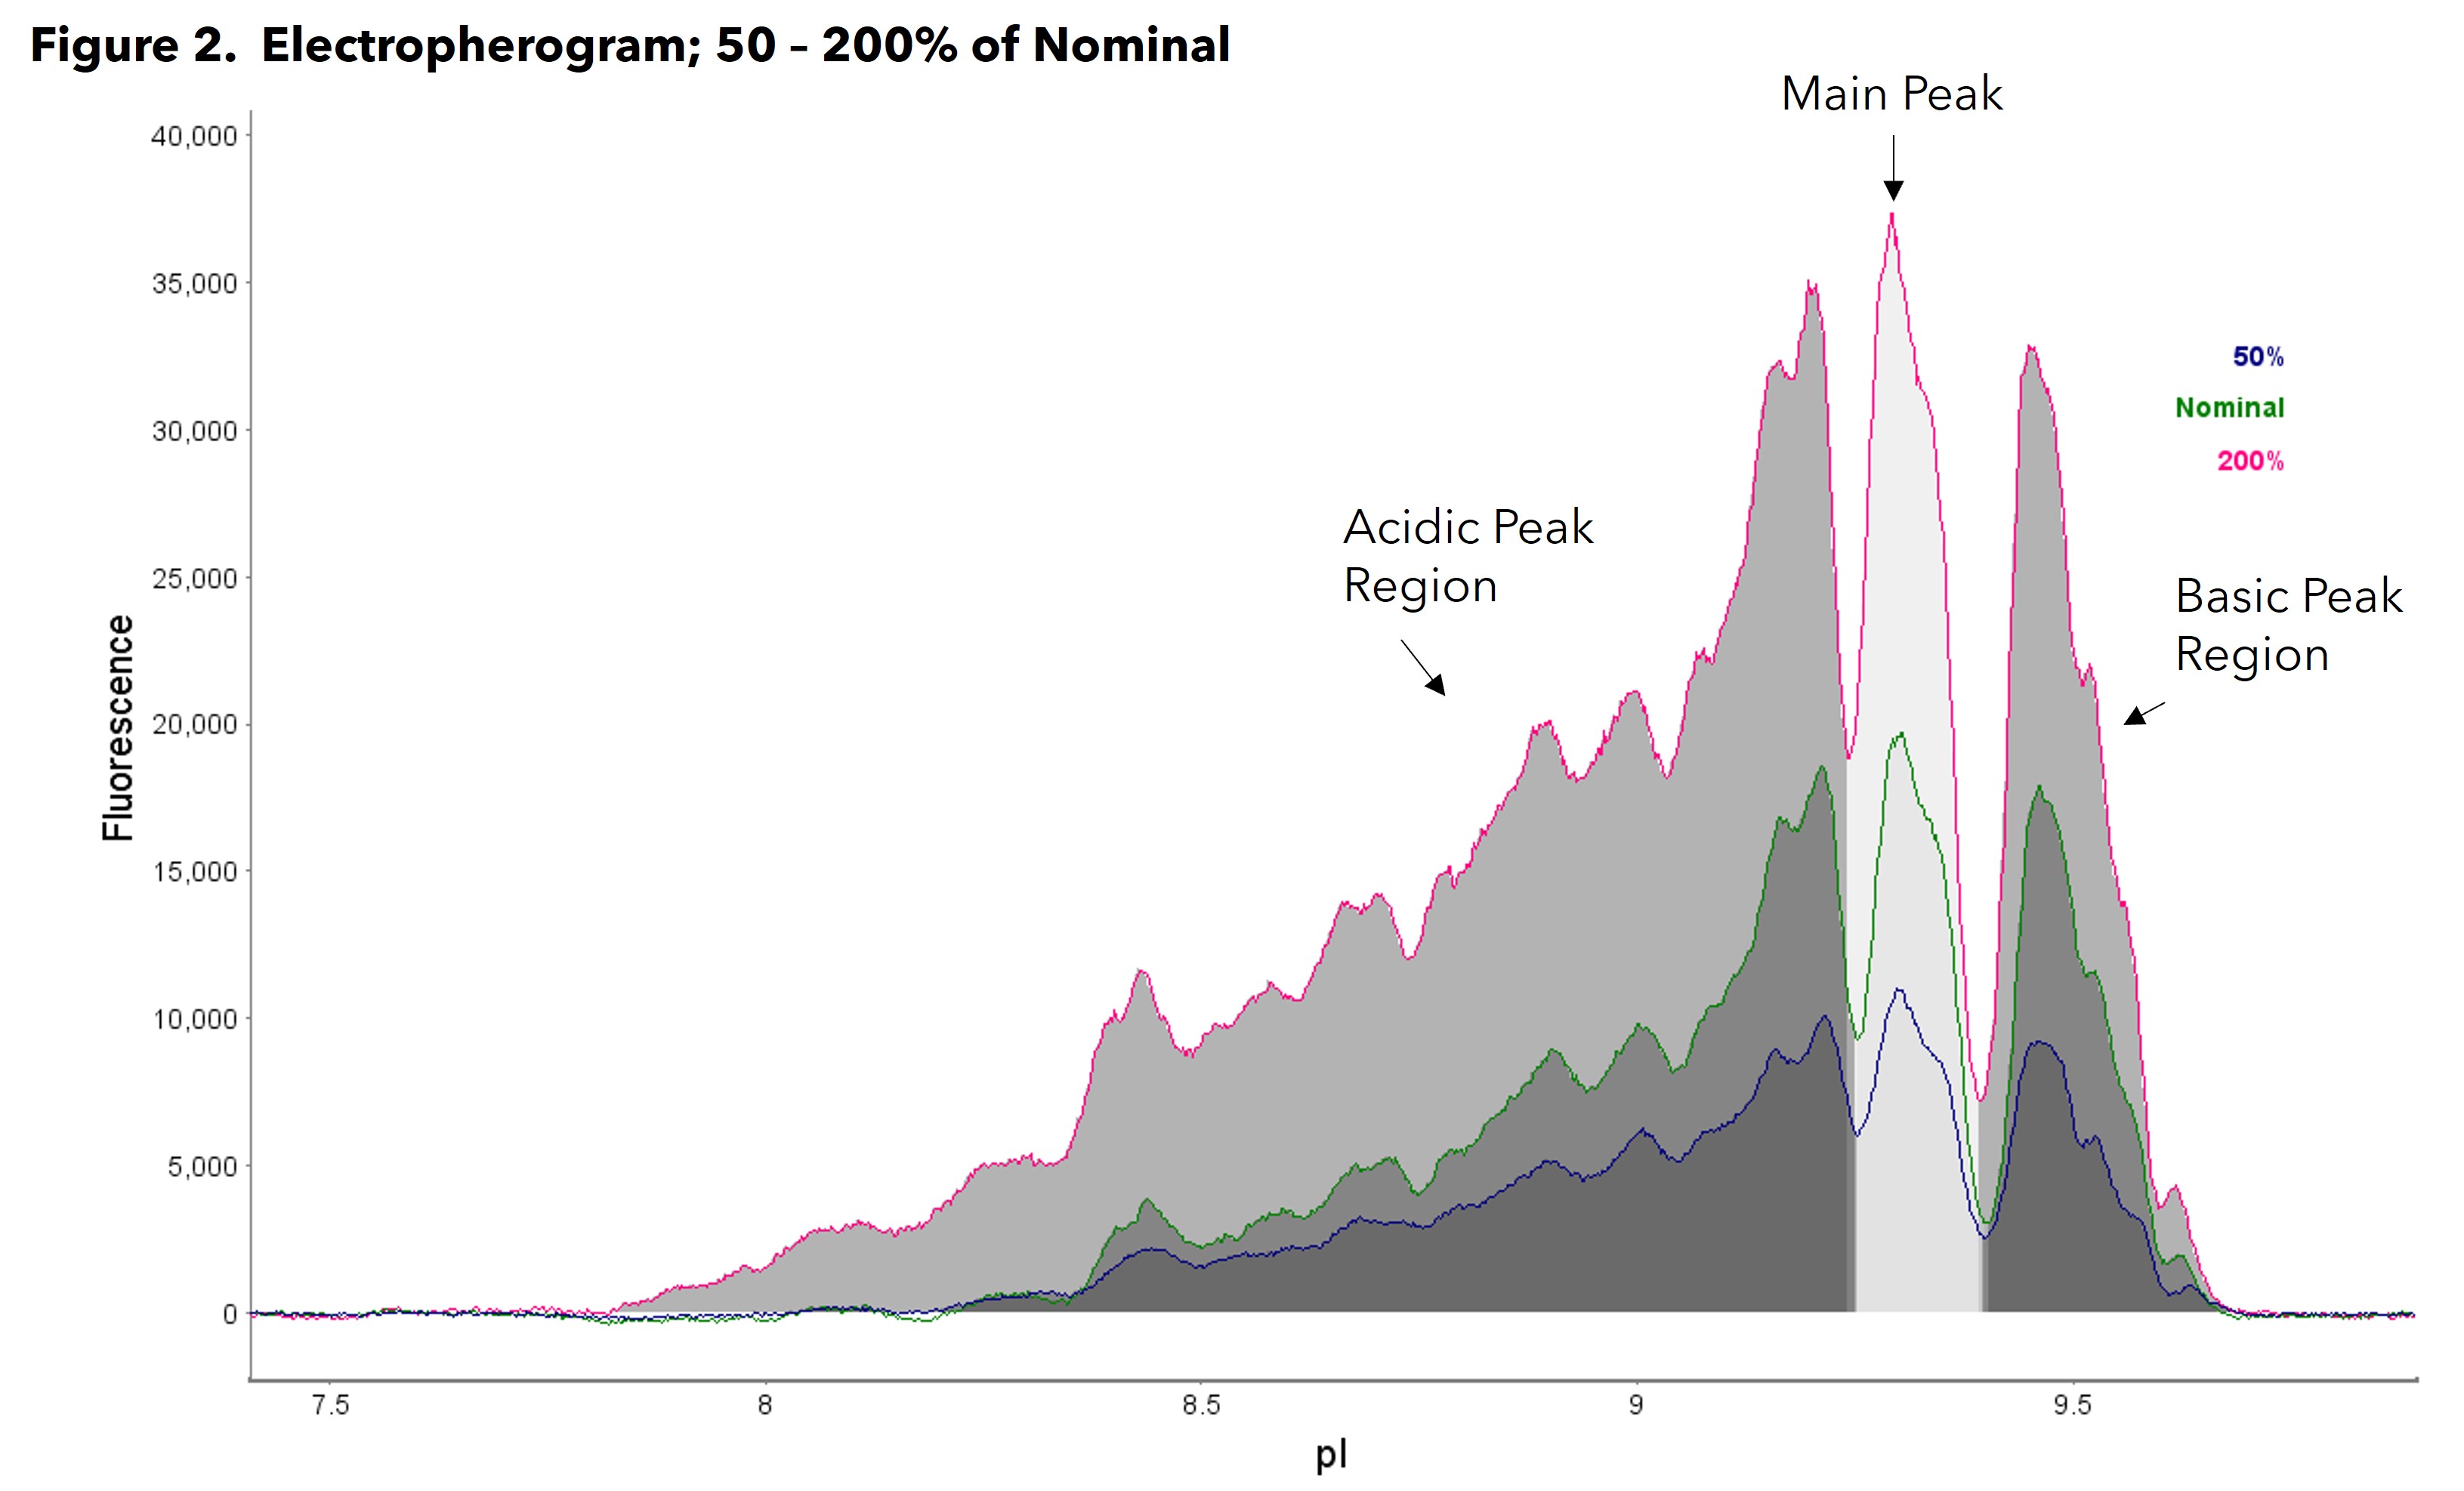
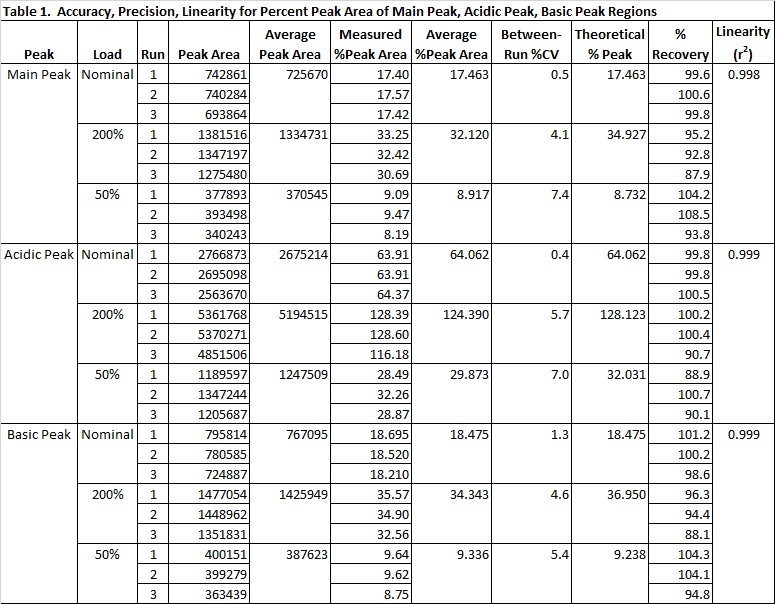
Purpose: Capillary isoelectric focusing (cIEF) is a method used to determine charge heterogeneity, a critical quality attribute of protein therapeutics. The method is commonly used as a release test, and can be used to monitor the manufacturing process as well as inform stability. Method validation evaluates accuracy, precision, and linearity of the method to ensure it is suitable for use in release testing, resulting in a validated range of the method that brackets release specifications. Spiking studies are commonly used for analytical methods where a known amount of purified analyte(s) can be added to drug matrix at varying levels to assess the range; however, for the determination of charge heterogeneity, producing samples in drug matrix with varying charge heterogeneity is challenging. For methods such as this, a reference material comparison approach can be used as an alternative to spiking studies. Methods: All cIEF runs were performed on the Protein Simple Maurice using the Protein Simple cIEF cartridges with Focus 1 set to 2 min, 1500 V and Focus 2 set to 15 min, 3000 V, and a load time of 55 seconds. A 20 second fluorescence exposure was used for the detection. The reference material used for the comparison was a polyclonal therapeutic diluted to 5.0 mg/mL in water, also referred to as the nominal sample. Test samples were prepared by diluting the same polyclonal therapeutic at concentrations of 50 – 200% of the nominal. The nominal sample and all test samples were then diluted 10-fold into a solution containing arginine, urea, ampholyte, and reference pI markers in methyl cellulose in proportions determined to be optimal for evaluation of the drug product by cIEF. Precision was evaluated based on the percent coefficient of variance (%CV) of the measurements of percent peak area (PA) for the Main peak, Acidic peak, and Basic peak regions. The Protein Simple Maurice software, Compass for iCE, reports the PA and the %PA for each peak region in each sample. The reported %PA for the nominal sample and both the 50% and 200% samples will be inherently similar as increasing or decreasing the sample load not only affects the PA for all individual peaks, but also the total PA, in the same proportion. Therefore, the PA reported for a peak region is used to calculate the %PA for that region using the PA and %PA values reported for the same peak region in the nominal sample. The calculation is based on the proportion of the test sample concentration to the nominal sample concentration. Equations for %CV and %PA are shown in Figure 1. Accuracy was evaluated based on the percent recovery of the calculated %PA for each peak region in each test sample from a theoretical expected %PA value calculated for the peak region. The theoretical expected %PA values are calculated using the reported PA for both the test sample and nominal sample and the proportion of the test sample concentrations to the nominal sample concentration. The equations for a theoretical expected %PA and percent recovery are also shown in Figure 1. Linearity was evaluated based on the coefficient of determination (r2) from the linear regression of the mean measured %PA value for each peak region in each test sample vs theoretical %PA values. Results: An electropherogram of the nominal load sample, 50% of nominal and 200% of nominal is shown in Figure 2. The accuracy, precision and linearity data are shown in Table 1. The data from the 50-200% samples pass suitable acceptance criteria as suggested by regulated guidelines. The %CV for between-run precision of the %PA was ≤ 20% for each peak region, the percent recovery was within 80 - 120% for each peak region, and the linear regressions of the mean measured %PA value vs theoretical %PA values for each peak region had r2 ≥ 0.98. Conclusion: The data confirm that the cIEF method is suitable for routine testing of this drug product, and is validated to measure %Main PA between 9 – 35%, %Acidic PA between 32 – 100%, and %Basic PA between 9 – 37% in this drug product. The wide ranges support the use of this method to release protein therapeutics as well as to monitor changes during stability. Changes in charge heterogeneity could reflect changes in post-translational modifications and/or tertiary structure. Because these changes can impact safety and efficacy, cIEF is a useful tool for evaluating this critical quality attribute of protein therapeutics.