
Track 1: Advances in Discovery, Formulation, and Delivery of New Modalities
Category: Poster Abstract
 photo")
Shashank Bhangde (he/him/his)
Doctoral Student
Northeastern University
Rockville, Maryland, United States
Shashank Bhangde (he/him/his)
Doctoral Student
Northeastern University
Rockville, Maryland, United States
Rushit N. Lodaya, Ph.D. (he/him/his)
GlaxoSmithKline plc
Rockville, Maryland, United States
Mansoor M. Amiji, Ph.D. (he/him/his)
Northeastern University
Boston, Massachusetts, United States
Derek T. O'Hagan, Ph.D. (he/him/his)
GlaxoSmithKline plc
Rockville, Maryland, United States
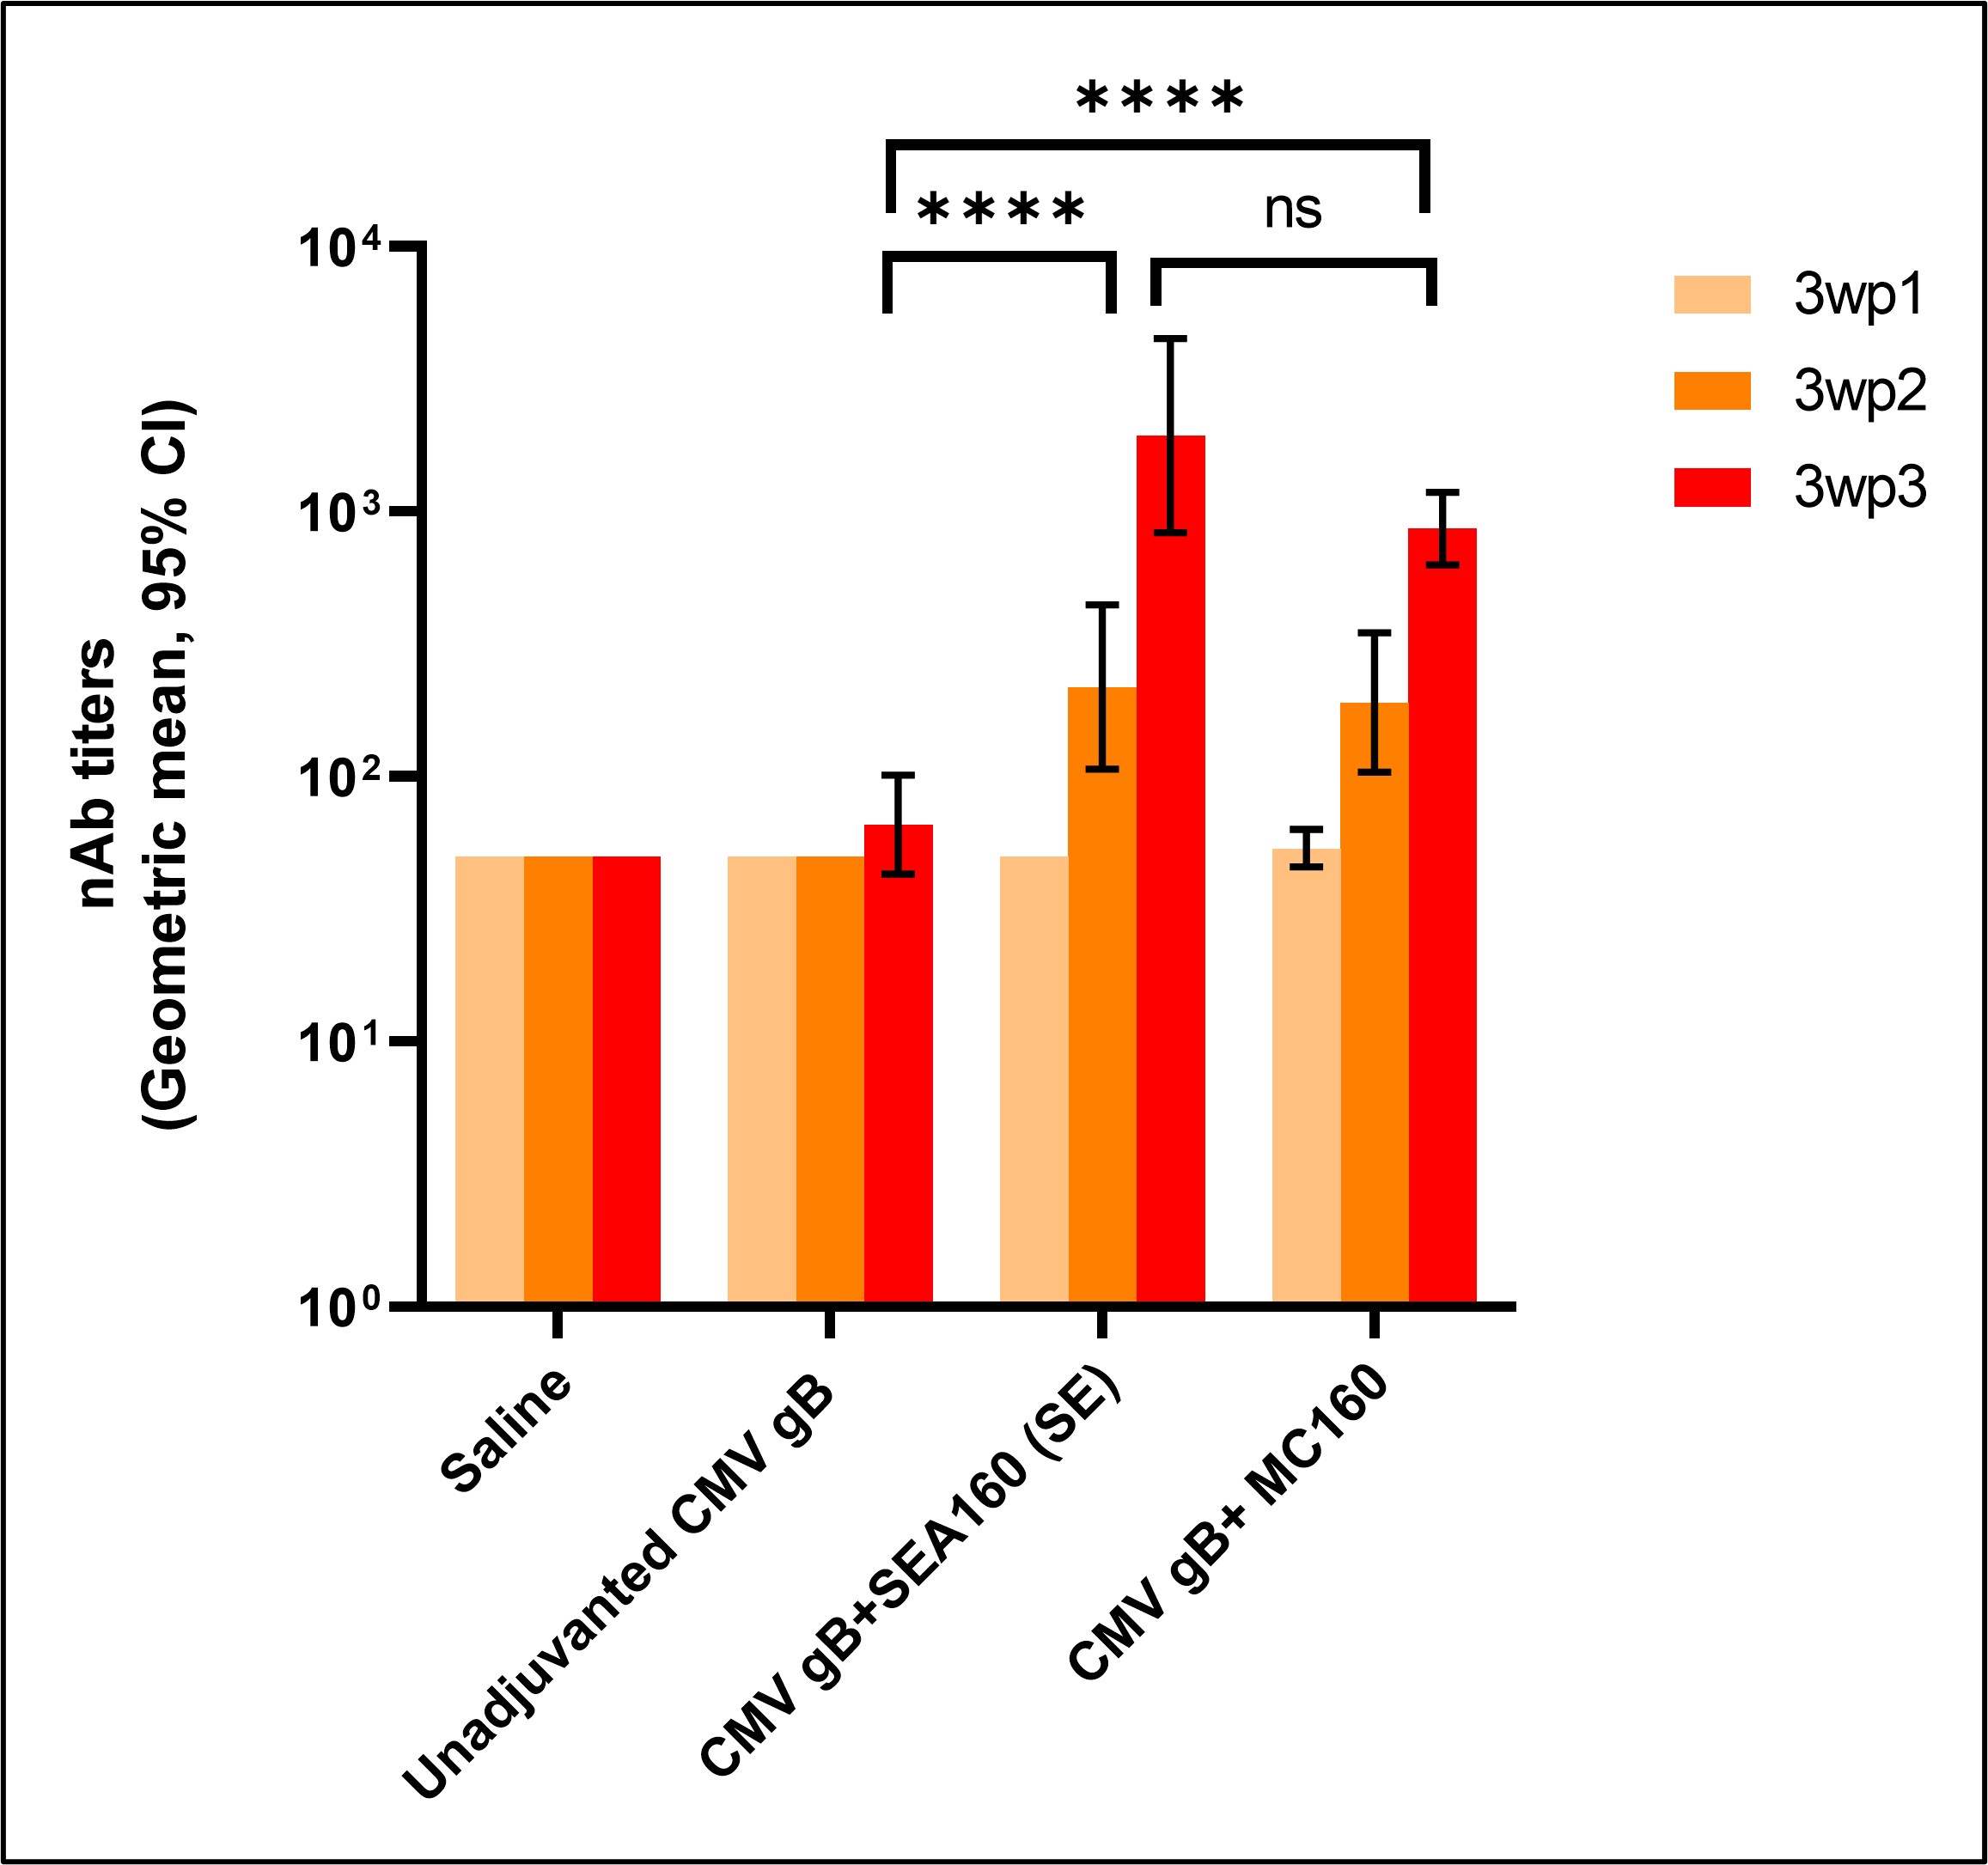 Neutralizing antibody titers in serum obtained three weeks post 1st, 2nd, and 3rd immunization, against CMV TB40 strain of virus. Each bar represents geometric mean titers (GMT) with 95% confidence interval (CI) from n=10 animals per group. Statistics were performed on titers post-log transformation using one-way ANOVA followed by Tukey’s test to compare all groups with each other. Differences are marked on the graph. All comparisons marked are for 3wp3 titers; where, ns = not significant, *= p˂0.05, **= p˂0.01, ***= p˂0.001 and ****= p˂0.0001
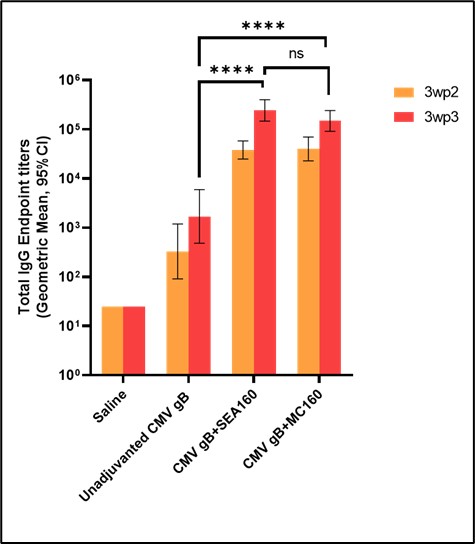 Total IgG antibody titers in serum obtained three weeks post 2nd and 3rd immunization, against CMV gB. Each bar represents geometric mean titers (GMT) with 95% confidence interval (CI) from n=10 animals per group. Statistics were performed on titers post-log transformation using one-way ANOVA followed by Tukey’s test to compare all groups with each other. Differences are marked on the graph. All comparisons marked are for 3wp3 titers; where, ns = not significant, *= p˂0.05, **= p˂0.01, ***= p˂0.001 and ****= p˂0.0001.
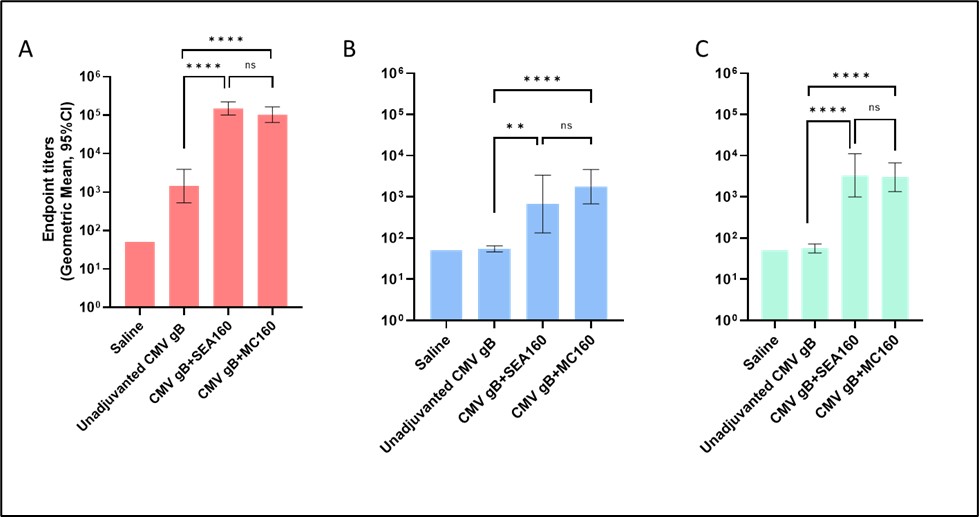 IgG subclass antibody titers (A: IgG1, B: IgG2a and C: IgG2b) in serum obtained three weeks post 3rd immunization, against CMV gB. Each bar represents geometric mean titers (GMT) with 95% confidence interval (CI) from n=10 animals per group. Statistical analyses were performed on titers post-log transformation using one-way ANOVA followed by Tukey’s test to compare all groups with each other. Differences are marked on the graph; where, ns = not significant, *= p˂0.05, **= p˂0.01, ***= p˂0.001 and ****= p˂0.0001