
Track 2: Novel Strategies to Advance Biotherapeutic Development
Category: Poster Abstract
Mandy Janssen (she/her/hers)
NanoImaging Services
San Diego, California, United States
Mandy Janssen (she/her/hers)
NanoImaging Services
San Diego, California, United States
Daphne Tortoles
NanoImaging Services
San Diego, California, United States
Brianna Fisher
NanoImaging Services
San Diego, California, United States
Adriana Trujillo
NanoImaging Services
San Diego, California, United States
Karen Fong
NanoImaging Services
San Diego, California, United States
Giovana Scapin
Nanoimaging Services
Woburn, Massachusetts, United States
Nicholas Boylan
Phosphorex
Hopkinton, Massachusetts, United States
Sydney Marchando
Phosphorex
Hopkinton, Massachusetts, United States
Ian Villamagna
Phosphorex
Hopkinton, Massachusetts, United States
.jpg) Figure 1. Cryo-TEM images of LNP formulations prepared using a T-mixer, the Ignite+, an impingement jet mixer, and the Sunshine.
Figure 1. Cryo-TEM images of LNP formulations prepared using a T-mixer, the Ignite+, an impingement jet mixer, and the Sunshine.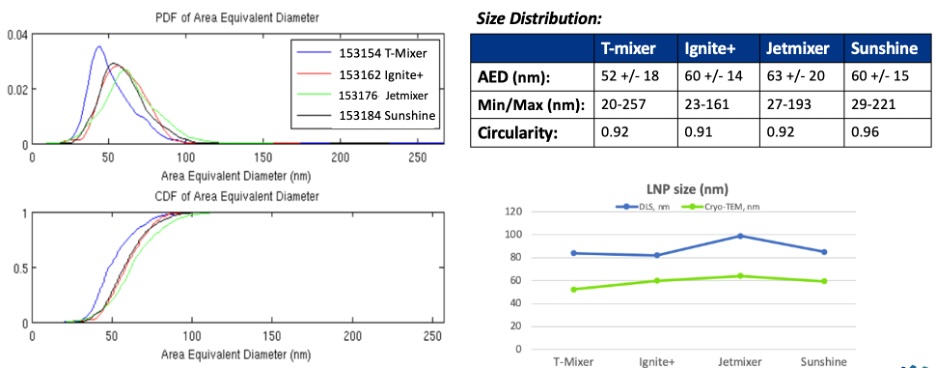 Figure 2. Size measurements of LNPs following image analyses of cryo-TEM images. Left: plots showing the probability distribution function (top) and cumulative distribution function (bottom. Right: Mean Area Equivalent Diameter (AED), range, and circularity calculated for each of the four LNP preparations (top); The average diameters calculated from cryo-TEM data compared DLS measurements (bottom).
 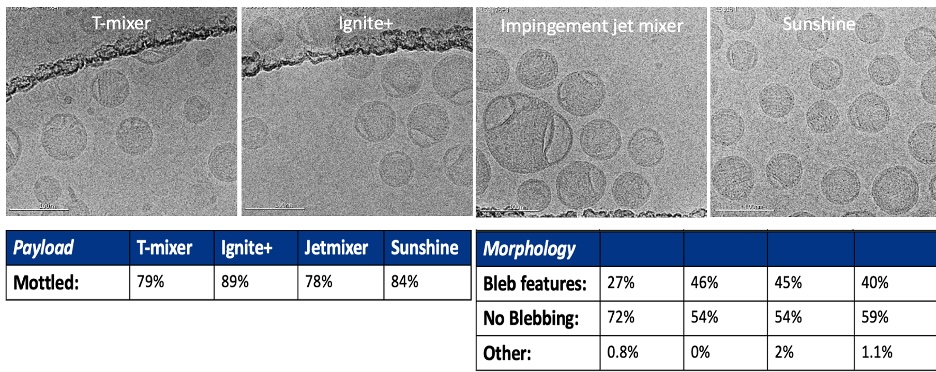 Figure 3. Top: Cryo-TEM images of LNP formulations prepared using four different mixing systems. Bottom: The left table shows the percentage of particles in each preparation that had a mottled appearance, indicative of the presence of nucleic acid. The table on the right shows the percentage of particles in each preparation with bleb structures with ‘other’ including multivesicular or multilamellar structures.