
Track 2: Novel Strategies to Advance Biotherapeutic Development
Category: Poster Abstract
Olagoke Sule
Genentech, Inc.
South San Francisco, California, United States
Olagoke Sule
Genentech, Inc.
South San Francisco, California, United States
Nastya Kassir
Genentech, Inc.
South San Francisco, California, United States
Junyi Li
Genentech, Inc.
South San Francisco, California, United States
 photo")
Phyllis Chan, PhD (she/her/hers)
Distinguished Scientist
Genentech, Inc.
South San Francisco, California, United States
Weize Huang
Genentech, Inc.
South San Francisco, California, United States
.jpg) Figure 1: Ratio of predicted PBPK to PopPK parameters for the evaluated bevacizumab dose regimens. The different colors represent the exposure metrics for Cycle one and steady state concentration. The Black dashed lines indicate the 0.5, 1-, and 1.5-fold prediction intervals. 1 representing a high correlation between the PBPK and PopPK simulations. The Red dashed lines indicate the 0.8- and 1.25-fold prediction intervals, representing the bioequivalence range.
Figure 1: Ratio of predicted PBPK to PopPK parameters for the evaluated bevacizumab dose regimens. The different colors represent the exposure metrics for Cycle one and steady state concentration. The Black dashed lines indicate the 0.5, 1-, and 1.5-fold prediction intervals. 1 representing a high correlation between the PBPK and PopPK simulations. The Red dashed lines indicate the 0.8- and 1.25-fold prediction intervals, representing the bioequivalence range.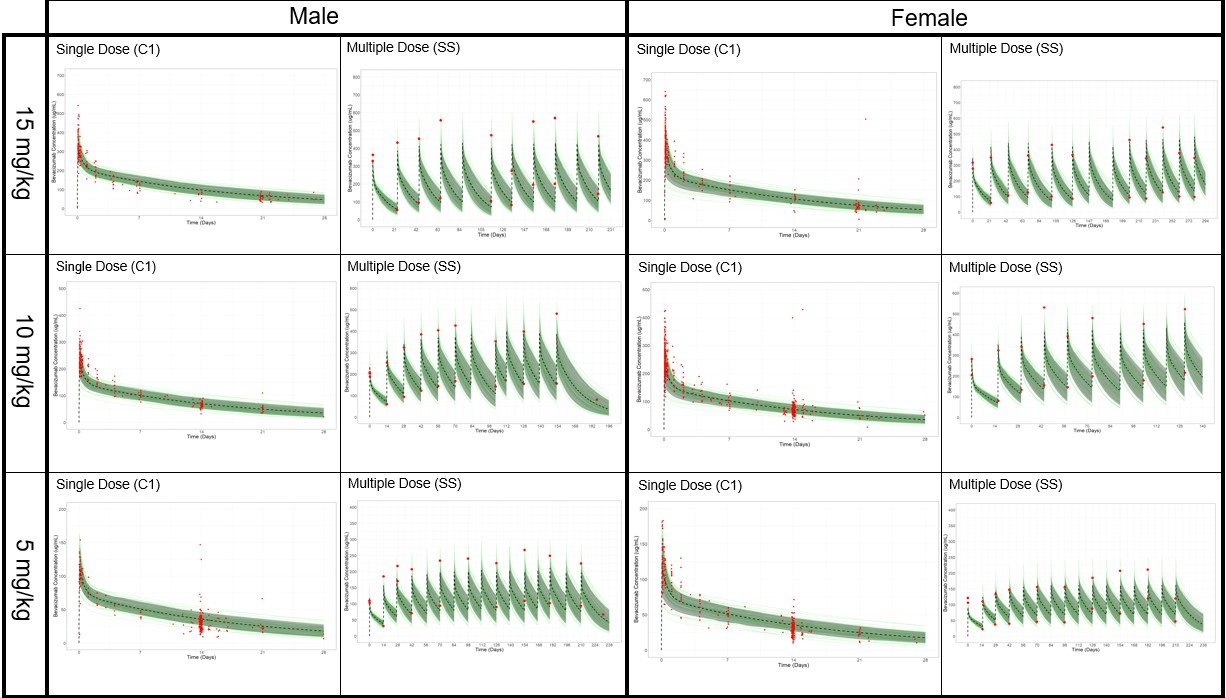 Figure 2: The red circles represent the observed data | The green lines represent 100 simulated individuals | The dashed black line represent the mean data for the simulated individuals | The green shaded area represent the 5th to 95th percentiles of the simulation